AIOps with Azure Metrics Advisor

AIOps is a term introduced by Gartner in 2016, referring to AI for IT Operations. It combines big data and machine learning to automate IT operations processes, including event correlation, anomaly detection, and causality determination. As more companies adopt digital transformation initiatives, we are seeing an explosion in digital systems and their associated data exhaust. By rationalizing digital signals in an intelligent way, AIOps plays a crucial role in helping companies reduce operation costs, improve engineering efficiency, and enhance customer experience. As a result, AIOps adoption has grown exponentially along with the uptick of digital transformation. Ponemon Institute© Research Report estimated that the cost-saving from AIOps systems is $17K/Outage∙min.

Microsoft is leading in the innovation and practices in this domain, with experiences learned from operating cloud services.

Much of the research and experiences have been exposed through the newly introduced Azure Metrics Advisor (AMA), and customers like Samsung has seen significant efficiency and accuracy boost in Smart TV monitoring through AIOps with AMA. This blog will help you understand how you can use AMA to solve your AIOps problems.
How to get started with Azure Metrics Advisor
What is Azure Metrics Advisor
Azure Metrics Advisor is an Applied AI Service designed to protect the performance of your organization’s growth engines, such as key IT services and operations. Its AI-powered monitoring features will not only allow you to stay one step ahead of incidents, but also assist you to quickly troubleshoot the probable cause of a problem.
Data preparation: map your AIOps problem to the dataset
The first key to successfully solving your AIOps problem is to format your dataset in a way that Azure Metrics Advisor (AMA) can digest. To help you get familiar with the data schema required for AMA to deliver multi-dimensional anomaly detection (AD) and root-cause analysis (RCA) for your business and service, let’s take an example.
Contoso is an e-commerce company that sells a wide range of products on its e-commerce websites. It is important to continuously monitor the business and service health metrics to identify issues and take action as early as possible. Specifically, Contoso monitors:
- Metrics ‘Revenue’ and ‘Cost’, which reflect the high-level business status
- Metric ‘DAU (Daily Active Users)’, which indicates customer engagement status
- Metrics ‘PLT (Page load time)’ and ‘CHR (Cache Hit Rate)’, which track their website service running status.
Moreover, as a global company that delivers various products, Contoso needs to segment all their metrics by ‘Product category’ and/or ‘Region’ for more meaningful insights. Thus, Contoso’s internal data science team mapped their metrics into a multi-dimensional dataset that can be split into thousands of time series, each representing a unique combination of ‘Product category’ and ‘Region’.
Metrics DAU, PLT, and CHR are more about website service health, so they are segmented by ‘Region’ to indicate which regions the web service might have issues. With all the metrics data ready, the next step is to get them onboarded to Azure Metrics Advisor.
Kindly note that it is not necessary to pre-process your data exactly like the schema above. If the data source is a query-able database, you can use a query to do the aggregation and make sure the output meets the above schema requirements.
Data onboarding
After all the metrics are ready in the above format, the next step is to onboard the formatted dataset to Azure Metrics Advisor. This is a simple step to register parameters such as what the data source is, how to connect, how to filter and aggregate, and what is the ingestion granularity (frequency). The entire onboarding process will only take a few minutes if you have the parameters handy. For more details, you can also refer to Azure Metrics Advisor documentation: Onboard your data feed to Metrics Advisor — Azure Cognitive Services | Microsoft Docs.
Tuning the detection
To optimize the anomaly detection results based on your business logic and contexts, there are two ways to customize your anomaly criteria:
- Sensitivity tuning + rules at various levels (metric, group, series):
- Metric level — tuning at this level will change all time-series under that metrics
- Group level — tuning at this level will change all time-series under that group, e.g., a group of specific dimension values (category or region in the above table)
- Series level — tuning at this level will change only one time series
- Adaptive learning: you can provide feedback on which data points should have been detected as anomalies and which ones should have been marked as normal. Azure Metrics Advisor will automatically learn from your feedback for future detections through underlying reinforcement learning algorithms.
For more details, refer to Configure your Metrics Advisor instance using the web portal — Azure Cognitive Services | Microsoft
Root cause analysis
In addition to the detected anomalies, Azure Metrics Advisor also offers insights into what might have been the cause of the issue to help you further troubleshoot. Stakeholders can get detection results via communication channels set up by the user, along with the anomaly detected and root cause analysis.
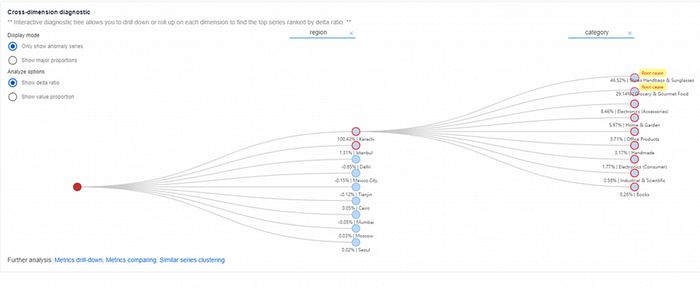
There are two layers of root cause analysis available. The first is to pinpoint the issue into specific dimensions. Going back to our Contoso example: if there is an anomaly captured on revenue metrics, Metrics Advisor will automatically pinpoint the issue into a specific ‘region’ or ‘category’ instead of searching manually.
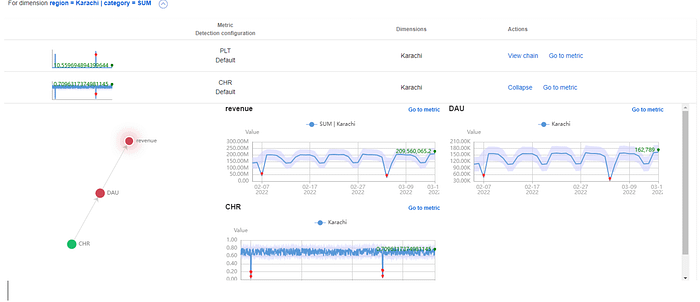
The second layer is based on a ‘metrics graph’, which describes the relationship among your metrics. Azure Metrics Advisor can correlate related anomalies along with the propagation chain. In Contoso’s case, if the root cause of an anomalous revenue drop is pinpointed to a specific region, Metrics Advisor will correlate anomalies in the same region from other metrics in the graph. With all insights from both layers, the final root cause can be located quickly for engineers to take actions to minimize the customer impact.
For more details, refer to Diagnose an incident using Metrics Advisor — Azure Cognitive Services | Microsoft Docs.
Reference architecture
Finally, let’s see how Contoso integrated AMA in their end-to-end AIOps workflow and architecture to monitor their business and IT service KPIs.
Contoso’s business objectives:
- Analyze multi-dimensional time-series data from ADX in real-time
- Configure and fine-tune the anomaly detection model
- Identify and correlate anomalies
- Diagnose anomalies and help with root cause
- Configure alerts for each metric
- Enable integration with the workflow engine via webhook
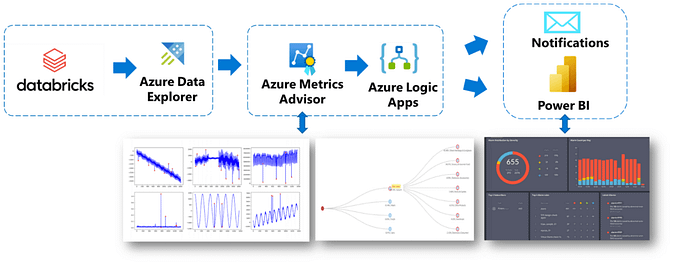
To achieve the above objectives, Contoso designed its solution flow as follows:

Given the solution flow they designed, Contoso built their final solution with AMA with the below architecture:
Get started today
Go to the Azure portal to create your new Metrics Advisor resource here. You can also read the Metrics Advisor document to learn more about the service capabilities. And you can find the sample dataset mentioned in the blog here.
Other than a web-based workspace, Azure Metrics Advisor can be used through SDK too, refer to Metrics Advisor client libraries REST API — Azure Cognitive Services | Microsoft Docs.
Read more data science articles on OpenDataScience.com, including tutorials and guides from beginner to advanced levels! Subscribe to our weekly newsletter here and receive the latest news every Thursday. You can also get data science training on-demand wherever you are with our Ai+ Training platform. Subscribe to our fast-growing Medium Publication too, the ODSC Journal, and inquire about becoming a writer.
