Data Imputation: Beyond Mean, Median, and Mode

Types of Missing Data
1.Unit Non-Response
Unit Non-Response refers to entire rows of missing data. An example of this might be people who choose not to fill out the census. Here, we don’t necessarily see Nans in our data, but we know there are values missing because we know what the real population of the US looks like.
Imputation Methods Include: Weight-Class Adjustments.
2.Item Non-Response
Item Non-Response is what most people think of as missing values. This is when specific cells of a column are missing, and the amount of missing data can take on any percentage of the column (I recommend the library missingno to visualize this).
Imputation Methods Include (from simplest to most advanced): Deductive Imputation, Mean/Median/Mode Imputation, Hot-Deck Imputation, Model-Based Imputation, Multiple Proper Stochastic Regression, and the Pattern Submodel Approach.
Choosing the appropriate method for your data will depend on the type of item non-response your facing. These are the possible categories:

A.MCAR
MCAR stands for Missing Completely at Random. This happens when missing values are missing independently from all the features as well as the target (including itself). This means there is no systematic difference between the missing and available data.
- MAR
MAR stands for Missing at Random. This occurs when the missing value is dependant on a variable, but independent from itself. For example, if we are collecting water-quality data and we have a day when our sensor breaks, then the missing values will depend on the date. However, they are completely independent of themselves (i.e. we’re missing pH because the sensor broke for a day, and not because there was a pH that the censor is incapable of reading). Here, there is still no systematic difference between the data we have or don’t have.
C.MNAR
MNAR stands for Missing Not at Random. This is the case where the missingness of a value is dependent on the value itself. Here, the data that is available and the missing data are systematically different. For example, in surveys, people with lower incomes are less likely to respond to questions about how much they make, and therefore the lower values are missing because they’re low.
Data Imputation Methods
- Weight-Class Adjustments
Pros: Fast — Very useful when data collection is unbalanced across classes.
Cons: Requires prior knowledge about the distribution of the data — Requires some data for every category in a dataset — Susceptible to outliers — Can increase the variance of estimates.
Handles: Unit Non-Response.
As the name suggests, this method takes the data that is available to us and re-weights it based on the true distribution of our population.
For example, say we are a make-up company and want to decide what to manufacture. For simplicity, let’s assume all the girls want to see shimmery finishes, all the boys want to see matte finishes, and all our queer costumers want to see glitter. In this case, let’s say we know that 40% of our costumers identify as queer, 10% as male and 60% as female, but this doesn’t match the proportion of people who answered our survey. Maybe we had 50 boys answer, 200 queer people answer, and 10 girls answer. This means that the findings of the survey would not be reflective of what our customer base really wants most, which we could fix by turning each set of answers into the real percentages.
As a warning, 10 girls is nothing to represent 60% of the population, because in the real world they would not all answer the same thing. Therefore, if we concluded that girls wanted shimmer and made this 60% of our data, but were wrong, we’d be hemorrhaging our earnings. Always remember this method hinges on good sampling, as well as knowing the true distribution of the data we’re collecting.
- Deductive Imputation
Pros: Minimal inference — Does not introduce variance or bias.
Cons: Coding intensive — Often not possible.
Handles: All types of missing data!
This type of imputation is perhaps the most obvious and least problematic, but many of us forget about it when we see large chunks of data missing. Sometimes, we can deduce missing values from the rest of the information, and while this can take a lot of coding for each individual set of deductions, it’s good practice.
For example, if we have information about pets and we have their birth dates but are missing some ages, we can easily fill these in.
- Mean/Median/Mode Imputation
Pros: Easy.
Cons: Distorts the histogram — Underestimates variance.
Handles: MCAR and MAR Item Non-Response.
This is the most common method of data imputation, where you just replace all the missing values with the mean, median or mode of the column. While this is useful if you’re in a rush because it’s easy and fast, it changes the statistical nature of the data. Not only does this skew our histograms, it also underestimates the variance in our data because we’re making numerous values the exact same (when in reality they evidently would not be). Therefore, while this practice is very common, you should do your best to avoid it. It will warp your results, and you should never use it if your data is MNAR!
4. Hot-Deck Imputation
Pros: Uses existing data.
Cons: Multivariable relationships are distorted.
Handles: MCAR and MAR Item Non-Response.
This method is another simple one, where missing values are replaced with random values from that column. While this has the advantage of being simple, be extra careful if you’re trying to examine the nature of the features and how they relate to each other, since multivariable relationships will be distorted.
- Model-Based Imputation (Regression, Bayesian, etc)
Pros: Improvement over Mean/Median/Mode Imputation.
Cons: Still distorts histograms — Underestimates variance.
Handles: MCAR and MAR Item Non-Response
This method predicts missing values as if they were a target, and can use different models, like Regression or Naive Bayes. In some cases, randomness is introduced, which generates slight improvements (i.e. Stochastic Regression is better than Regression).
- Proper Multiple Stochastic Regression
Pros: The variance is accurate — It’s a well-tested method.
Cons: Requires more effort — Computationally intensive.
Handles: MCAR and MAR Item Non-Response.
PMSR is much more complex than the other methods we have looked at, but can still be implemented relatively quickly using fancyimpute. Here, we take advantage of the Stochastic Regression imputation method, but we do it “multiple” times. In order to achieve this, we make copies of our data set, including the empty cells. We then fill in each copy with predictions from a unique Stochastic Regression model, and therefore, it’s like inserting a little histogram into each empty cell! And Voila: we have kept our variance accurate!
7. Pattern Submodel Approach
Pros: Handles all types of Item Non-Response! — It does not underestimate variance.
Cons: Not well tested — Labor-intensive.
Handles: All types of Item Non-Response(including MNAR)!
This method is the newest, fanciest and most adequate imputation technique available. It consists of breaking the data up into different missingness patterns, and then fitting a model to each in order to predict the values. This makes no assumptions, it’s computationally efficient (although it might be labor-intensive) and it can handle MNAR data. Here is an example of what we mean by missingness patterns:
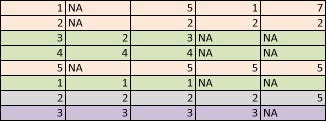
Note that the purple pattern only has 1 row, so we might want to clump it with other small missingness patterns to avoid overfitting.
Code samples for some of these approaches are available at this amazing repository by Matt Brems (a missing data wizard who inspired me to put this article together): https://github.com/matthewbrems/missing-data-workshop?fbclid=IwAR1LGjaIen-ITLndPN1ODV1lYZBvxsHDs0DgIaPkuxpXMsQRBT8eAPI-0sI
Bibliography:
https://drive.google.com/viewerng/viewer?url=https://www.stat.columbia.edu/~gelman/arm/missing.pdf
https://academic.oup.com/biostatistics/advance-article/doi/10.1093/biostatistics/kxy040/5092384
Read more data science articles on OpenDataScience.com, including tutorials and guides from beginner to advanced levels! Subscribe to our weekly newsletter here and receive the latest news every Thursday.
