Mastering A/B Testing: From Design to Analysis
A/B testing is a critical tool leveraged by data scientists to estimate the expected outcome of a certain action like updating software, adding new features, or deploying a new web layout. Proper experimental design is crucial to realizing the benefits of A/B testing and avoiding the pitfalls that detract from the accuracy of the estimate. At ODSC West in 2018, Guillaume Saint-Jacques and Yav Bojinov explained the fundamentals of experimental design for A/B testing and addressed some techniques to address common challenges.
[Related Article: Validating Type I and II Errors in A/B Tests in R]
Many are familiar with the concept of A/B testing in the context of comparing a control group and a treatment group. We want to understand if the treatment conclusively had a positive impact on a certain metric we care about. In many cases, this involves splitting users or samples of some kind into two groups randomly; the point of randomization is to ensure that confounding variables do not obscure the true impact of the treatment.

A brief refresher on confounding variables, they are attributes that are correlated with both the dependent variable and the treatment. Sufficiently satisfied that each group contains an equal representation of confounding variables, we can go ahead and compare the metrics of each group. A t-test is often used to determine whether the mean values of the metric for each group are sufficiently different; the test measures the difference in group means with respect to the group variances.
Often it is not possible to conduct A/B testing with equal representation of confounding variables. The authors offered an example of a company offering a new software update; very keen users will download the update on their own, regardless of their assignment to the control or treatment group. In this example, the confounding variable could be the number of sessions for each user, as very keen users were more likely to be in the treatment group than those who use the service less frequently.

Comparing the red and blue groups above with a t-test would be inappropriate due to the confounding variable “Total Sessions”; one way to address this is to use propensity scoring. The idea behind propensity scoring is to estimate the probability of receiving the treatment for each user based on the covariates available, and compare users that have the same propensity score. Propensity scores are calculated by fitting a logistic regression model with the dependent variable treatment, and covariates as independent variables, then obtaining the predicted probability of receiving treatment for each record. Users in the treatment group can then be compared with those with the same propensity score in the control group.
Dealing with confounding effects becomes more challenging when users are highly connected to each other in a network like on LinkedIn or Facebook. If the treatment group is assigned randomly, the experience of users in the control group who are connected to those in the treatment group may be impacted in a way that confounds the metric measurement. In statistics, we consider the two users in a common network as dependent; a key assumption in statistical tests like the t-test is independence among all samples. To test for network effects, the authors recommend conducting both a regular A/B test (i.e. where users are included in the treatment group with equal probability) and a clustered A/B test where users are grouped based on network connectivity. The two tests should give the same result if there isn’t a network effect.

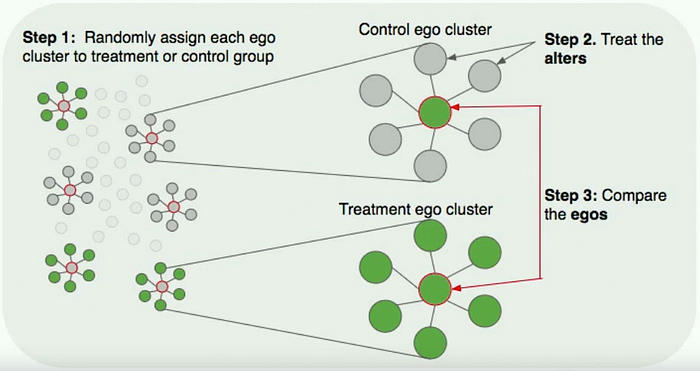
If a network effect exists, it is necessary to measure the effect prior to proceeding with A/B testing. At LinkedIn, the authors use a technique called ego-clustering, where you can measure the network effect by calculating the difference between the effect when all one’s connections are treated versus when none of them are treated. By measuring the change in metric values between treated clusters and control clusters, one can calibrate the original A/B test appropriately. One drawback of trying to isolate clusters and treat them as separate samples is that in many cases the user base is too well connected to obtain a large number of well-isolated clusters.
[Related Article: Model Interpretation: What and How?]
The key takeaway from Guillaume Saint-Jacques and Yav Bojinov’s presentation is that data scientists need to address confounding effects that impact the metric being measured; in many cases, the confounding effects are challenging to identify and resolve. The authors provided a number of techniques for addressing challenges in addition to those discussed here that can support better data science.
Read more data science articles on OpenDataScience.com, including tutorials and guides from beginner to advanced levels! Subscribe to our weekly newsletter here and receive the latest news every Thursday.
